Reporting Relationships Matter to Successful Organizations

Reporting relationships still matter. Sure, there’s a lot of buzzwords about flat hierarchies, dotted-line org charts, and network structures. If those words are confusing, you’re not alone.

reporting relationships matter

The jargon can get annoying. The word “Hierarchy” can be perceived as oppressive. The word “Network” can be perceived as modern. But if you get back to basics, successful organizations have clarity in their reporting relationships, no matter what word they use to describe it.

Problems with unclear reporting relationships

Think about your colleagues. Imagine asking them, “Who do you report to when you finish your top priority task?” Could you build a coherent org chart based on their answers? If not, then you might have problems with unclear reporting lines.

Organizations often come to us because of a major problem with their structure. They often have an org chart that was created in their board room. And then they have a very different undefined org chart based on how their people truly work together. What’s the problem with this situation?

  • Management isn’t connected to how people report to each other
  • Employees don’t understand the official hierarchy, so they get things done their own way
  • Either way, there is a fundamental disconnect that needs to be fixed before the business can improve

Reporting relationships to avoid

Reporting relationship loops

  • Abe reports to Barb who reports to Caroline who reports to Abe.
  • Or to put it another way: A-B-C-A

Disembodied reporting relationships

  • Abe reports to Barb who doesn’t report to anyone
  • This would be: A-B-?

Reverse reporting relationships

  • Barb is the boss, but ends up reporting to Abe about her tasks most of the time
  • Clearly this type of relationship is: B-A

Painful reporting relationships

  • Abe reports to Barb sometimes, Caroline other times, Dan now and then, and Emma often asks what’s going on
  • In other words: A-B,C,D,E

Back to basics reporting relationships

How your people report to each other should be good for everyone. An employee should feel like his tasks matter for a goal bigger than himself and be proud to tell his manager what he accomplished. A manager should be eager to measure the output of her employees and bundle it all together to meet an even bigger goal. Instead of focusing on power and fear, your organization’s reporting lines should focus on completing and measuring meaningful work.

Here’s a quick list to help you get started with better reporting relationships:

  • Focus on one task for one person at time. Clarify who she should report to.
  • Next, draw the reporting relationship (or use an org chart software to save time)
  • Then, show the drawing of the reporting relationships to everyone. Verify it makes sense.
  • Never stop updating the reporting relationships. Your organization is a living ecosystem.
How to Embed an Org Chart Online

Org charts usually get shared as a PDF, which is static and a little boring. But what if you could embed an online org chart on your website or intranet? It would bring your org charts to life in a way that was previously not possible.Embed org chart online instead of printing PDF

Here’s how to get started with embedding an org chart:

  1. Log in to your preferred org chart software. In this case, we’re using OrgWeaver and Organimi as examples.
  2. Share a public version of your org chart. You’ll need a URL that looks something like this: https://app.orgweaver.com/pub/XPKKSJ
  3. Create an embed code using an iFrame that will look something like this: “<iframe src=”https://app.orgweaver.com/pub/XPKKSJ” height=”600px” width=”800px”></iframe>”
  4. Paste the iFrame code within the <body> tag on your website. If you don’t know how to do that, then reach out to whoever runs your intranet or website (they’ll know what to do)

Troubleshooting iFrame org chart embeds

  • Some online org charts won’t allow you to use an iFrame. To check on your own, enter the URL of the org chart software you’re trying to use at this iFrame checker. If there are errors, then you’ll have to contact your org chart software vendor.
  • There are many different iFrame settings that are available. Try using an iFrame generator to explore different options to make your org chart look great in an iFrame.
  • Make sure that both your website, and the online org chart are using HTTPS instead of HTTP

Embedded org chart example

Try to do the following with this embedded org chart from OrgWeaver:

  • Expand/collapse org chart levels
  • Use your mouse to move the org chart
  • Zoom in and out

Example: Org Chart Levels for Designers

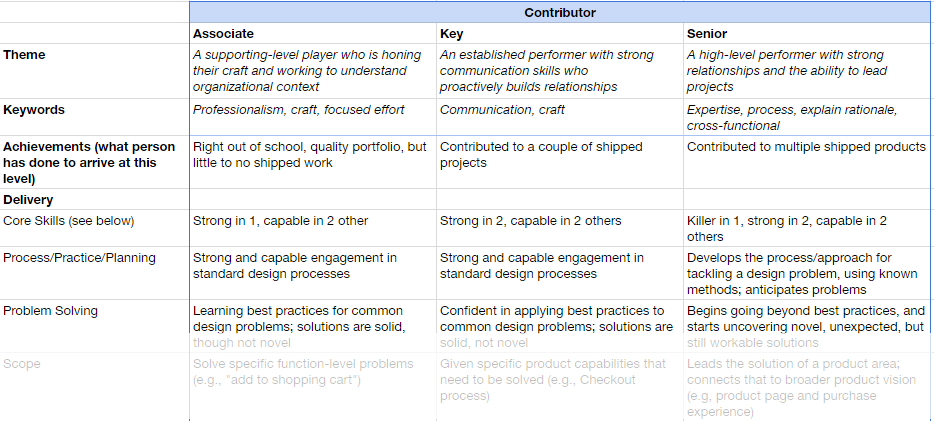
Peter Merholz literally wrote the book on “Org Design for Design Orgs.” Org design isn’t easy, which is why it’s very helpful to look to experts like Peter before diving into it. In his blog post entitled “Have better career conversations with your design team with this levels framework“, Peter actually shares detailed job descriptions for each level of his design org.

org design level example

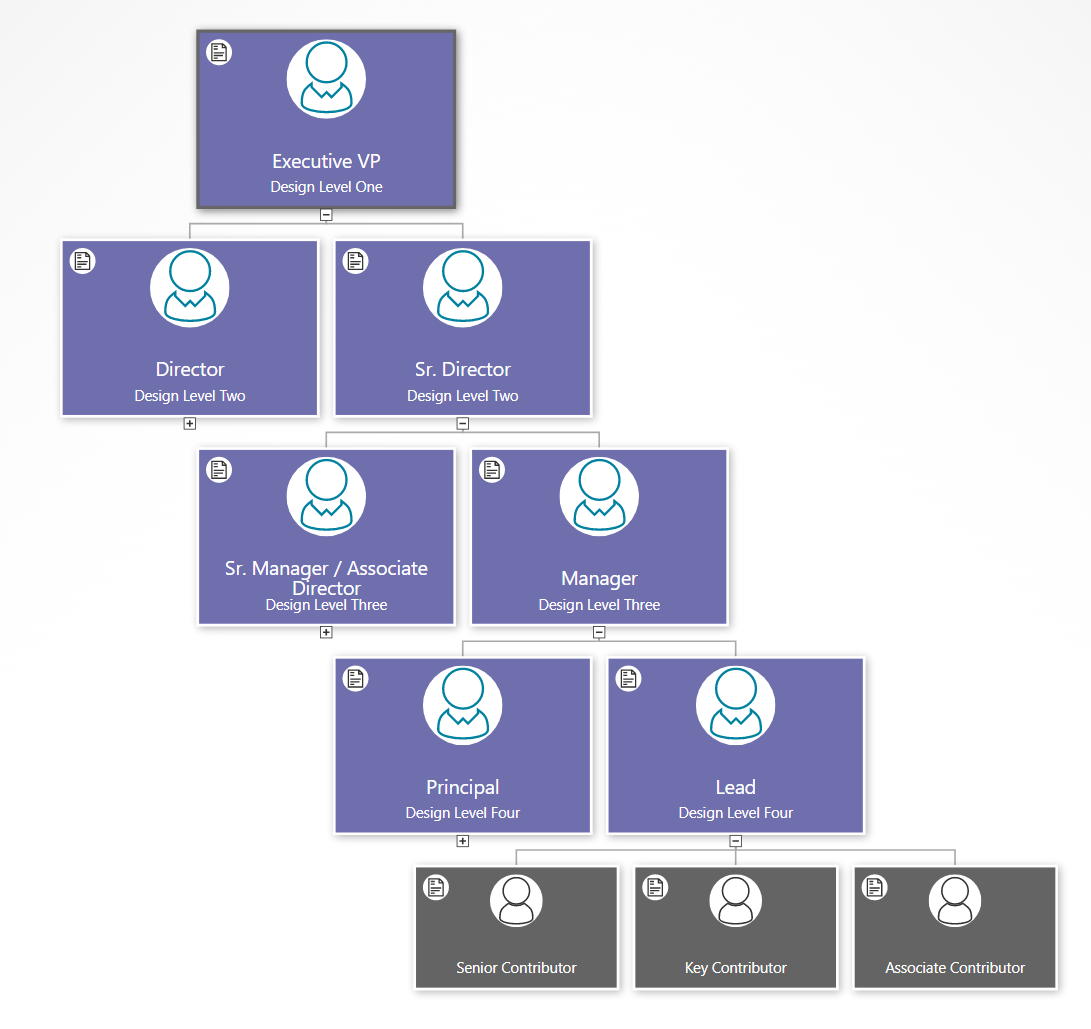
The design team role descriptions include:

  • Executive VP
  • Sr. Director
  • Director
  • Sr. Manager / Associate Director
  • Manager
  • Principal
  • Lead
  • Sr. Contributor
  • Key Contributor
  • Associate Contributor

For each role description, Peter outlines these key aspects:

  • Themes
  • Keywords
  • Achievements
  • Delivery
  • Core skills
  • Process/Practice/Planning
  • Problem Solving
  • Scope
  • Communication
  • Presentation
  • Cross-functional Meetings
  • Leadership
  • Relationship with team
  • People Management
  • Recruiting / Hiring

While this is a specific case for one area of a business, the spreadsheet that Peter shares is fascinating for anyone struggling with ways to clearly define roles and organize them into levels.

We often get requests at OrgWeaver to help with visualizing org designs, org levels, and position descriptions. Since Peter was so kind as to share his information with the world, we thought we’d return the favor and visualize his org design online for the world to see. Click the image below to open the interactive online org chart version.

org design levels template

View job descriptions

Within OrgWeaver, it’s easy to view each position description by clicking the document link in the corner of each org chart box. To add position descriptions, we just copied and pasted from Peter’s spreadsheet directly into the org chart.

Organize positions into levels

Based on Peter’s spreadsheet, we added levels for each position in the org chart. Click the expand button at the bottom of the boxes to see lower levels of the org chart. There are of course other ways to define these levels, which is why we built OrgWeaver to easily drag and drop positions into a different hierarchy.

Org chart design: Choose a layout that your team will love

With the right org chart software, you can make the best org chart design. The design of your org chart matters; it’s how your team, new recruits, partners, suppliers, and stakeholders understand who is in charge of what.

If you’re starting with a blank screen in front of you, and don’t know where to start with your org chart design, here are some tips on how to clarify what is most important for your unique team.

Choosing an org chart design

Org charts are made up of boxes that are organized by levels. It sounds simple, but can quickly get complicated if you’re not clear about a few things:

  • Should all org chart boxes include the same information?
    • If yes, then it’s simple to start adding names and titles to your boxes
    • If no, then what boxes need to be different? Should manager boxes have more information (such as headcount, department name, location, phone number, etc.)? Should regular employee boxes be smaller with less information?
    • Tip: Make sure you can edit all boxes at once so you don’t waste time going back and changing hundreds of boxes by hand.
  • Should levels be comparable? For instance, should a “Sr. Manager” in the Sales department be able to visually see that she is on the same level as a “Sr. Manager” in the Finance department?
    • If yes, then be strict with how you place boxes in your org chart.
    • If no, then you can place boxes wherever they fit best on the screen.
  • What colors do you want your org chart boxes to be?
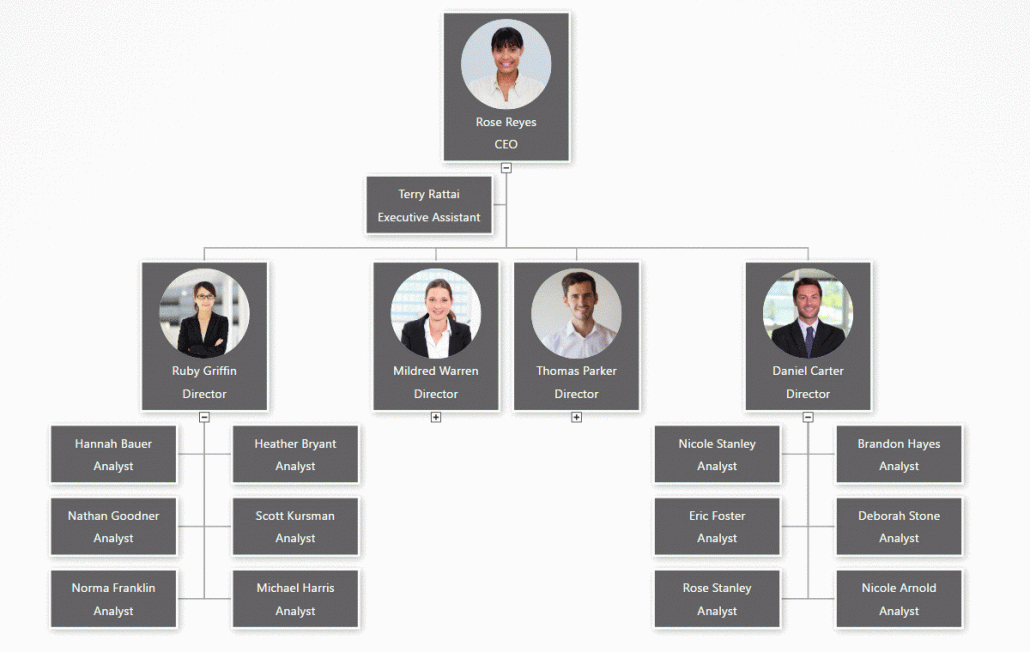
    • Often, a neutral color is easy to read.
    • However, it can be much more personal to use your brand’s official colors.

Org chart software design: Simple white example

org chart design white template example

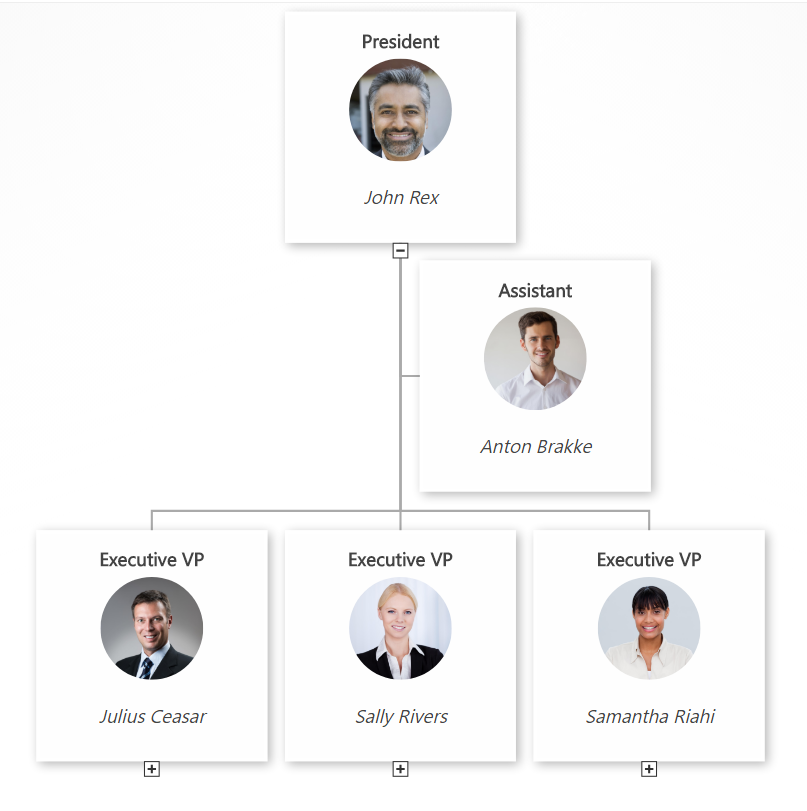
This org chart design example has a very simple black text layout on white boxes. It’s easy to see that of the 4 people that report to the CEO, three of them are on level 2, and one of them is an assistant without a level. Every box includes the same basic info about job title and employee name. An org chart like this is very easy to glance at and understand.

Org chart software design: Simple gray example

org chart design simple gray example

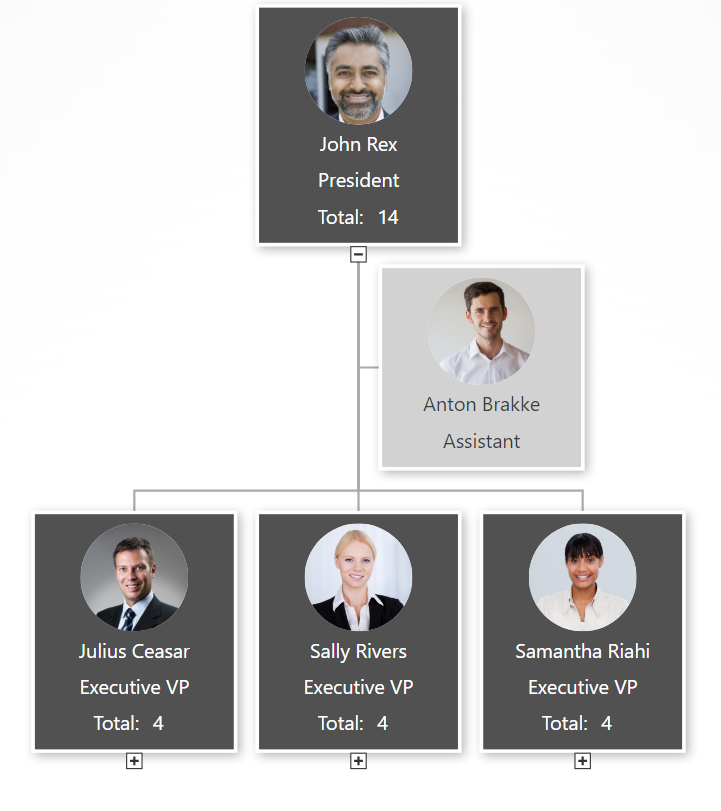
In this example of an org chart, some different design choices were taken. For example, manager boxes include some extra information about total headcount (automatically calculated by the OrgWeaver org chart software). Also, there is a different color for managers (dark gray) and assistants (light gray) to more strongly differentiate between levels within the org chart.

Org chart software design: Detailed black example

org chart design detailed example

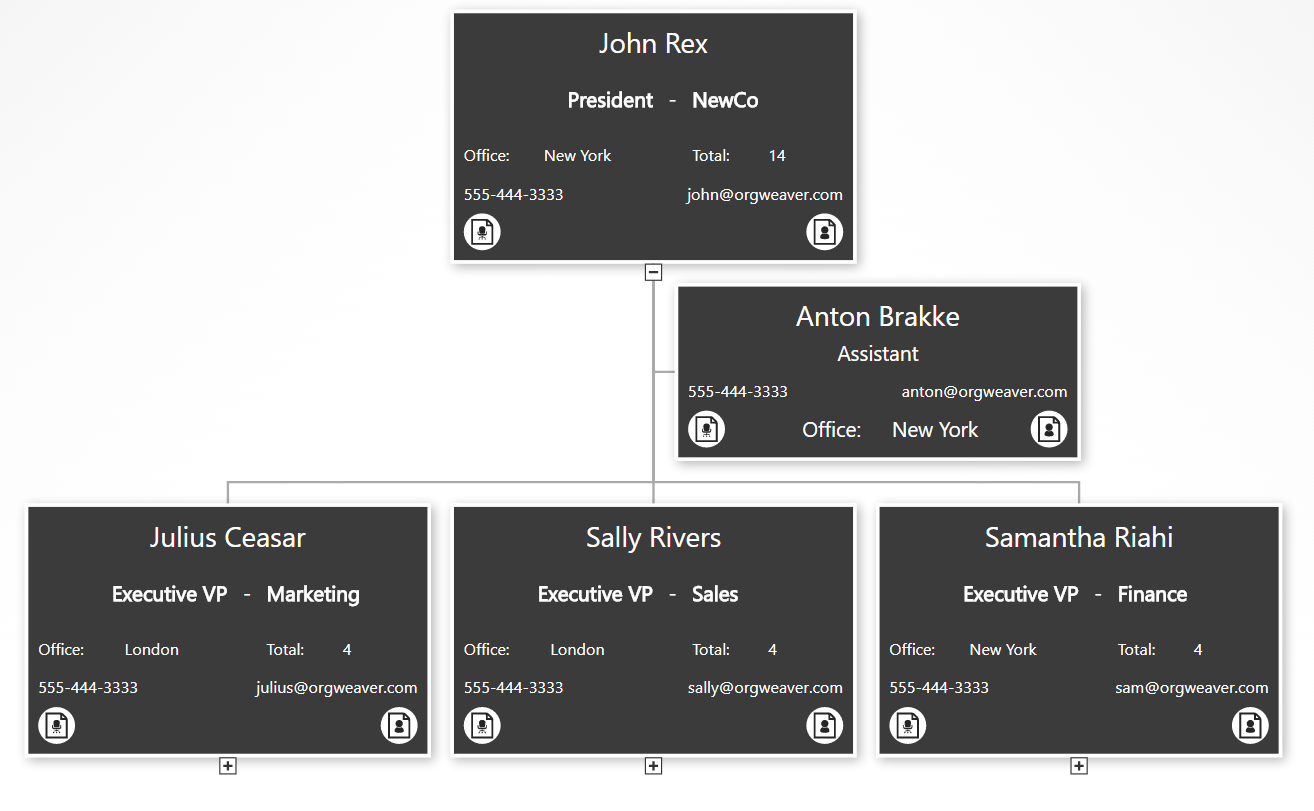
This org chart example gives much more detailed information. As you can see, the core info about the employee and the job title are still there, but we’ve added data about a department/unit, office location, phone email, job description, and employee bio. To make room for it all, we’ve removed the employee photo. Also, we’ve made all of the boxes the same color, but show less info for people that are not managers (see the “Anton Brakke” box).

Org chart software design: Basic branded example

org chart design branded example


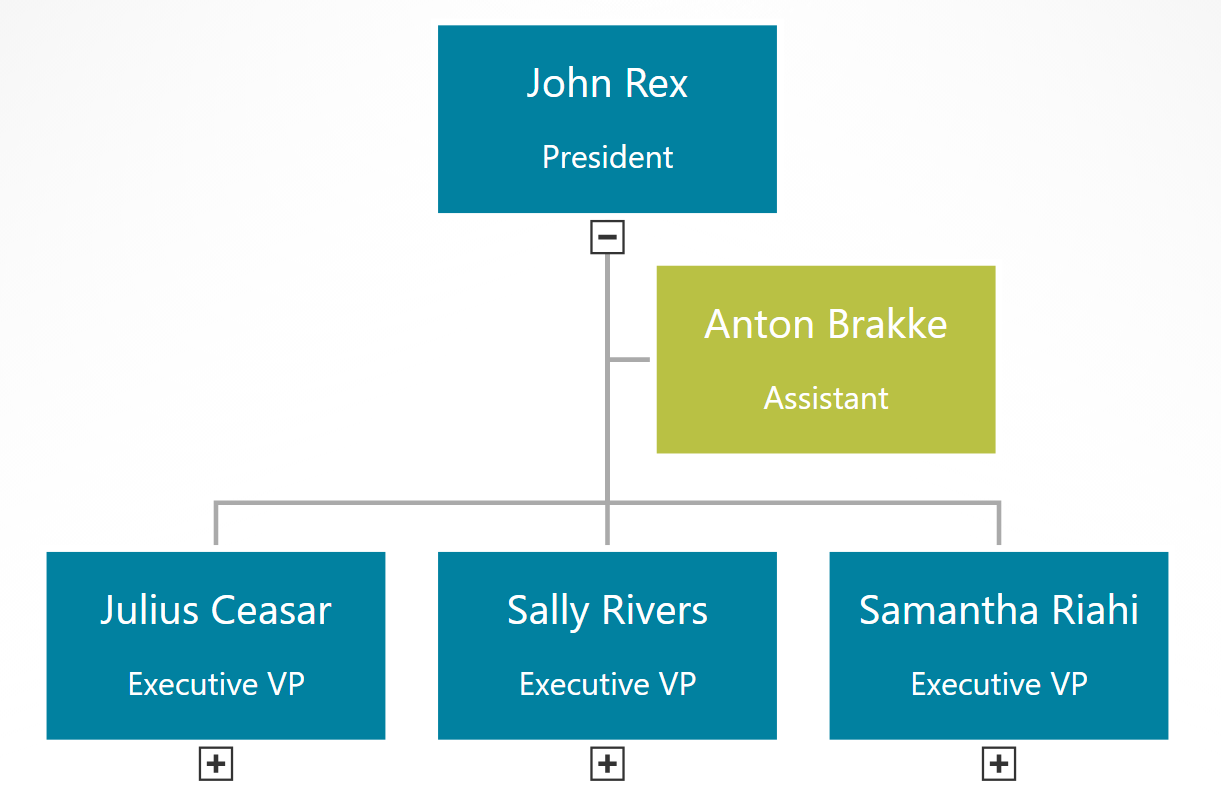
This final example built with online org chart software strips away everything to the basics, but uses branded colors instead of neutral colors. This type of org chart can give your team the feeling that it was truly designed for them.

How to add org chart colors that fit your brand

Take the time to color your org chart to fit your brand identity and styles. Organizational charts are everywhere, but rarely make people say “Wow!”. For the same reason that web designers agonize over color palettes, your org chart could have much more impact with the right colors and styles. Here’s a quick overview of how to do it and some examples of OrgWeaver org charts that are perfectly color matched to some of the world’s most recognized brands.

Find your brand’s official colors

  • Many well-known brands have their colors available online. Try Brand Colors
  • Or add a color picker to your Chrome browser (like Colorzilla) and pick your brand’s colors directly from your website
  • Copy the Hex code for each color you want to use in your org chart (here’s an example of a Hex code for Google’s blue brand color: #4285F4)

Add colors to your org chart software

  • Open OrgWeaver org chart software
  • Go to the area where you can edit your org chart and change the org chart color theme by pasting in the Hex color codes of your brand. You can also just pick a color w


Change styles of your org chart

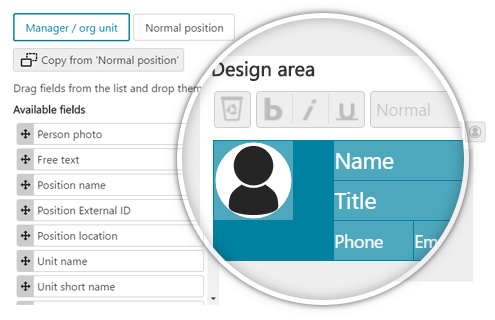
  • Choose how much data to show in each org chart box. Focus on just profile photos, names, and titles, or get more detailed with contact info, unit name, position description, and much more.
  • Drag and drop each piece of data so they fit perfectly in the org chart box. Save one style that automatically updates hundreds of org chart boxes.

Org chart color examples

Blue and green org chart like Google’s brand

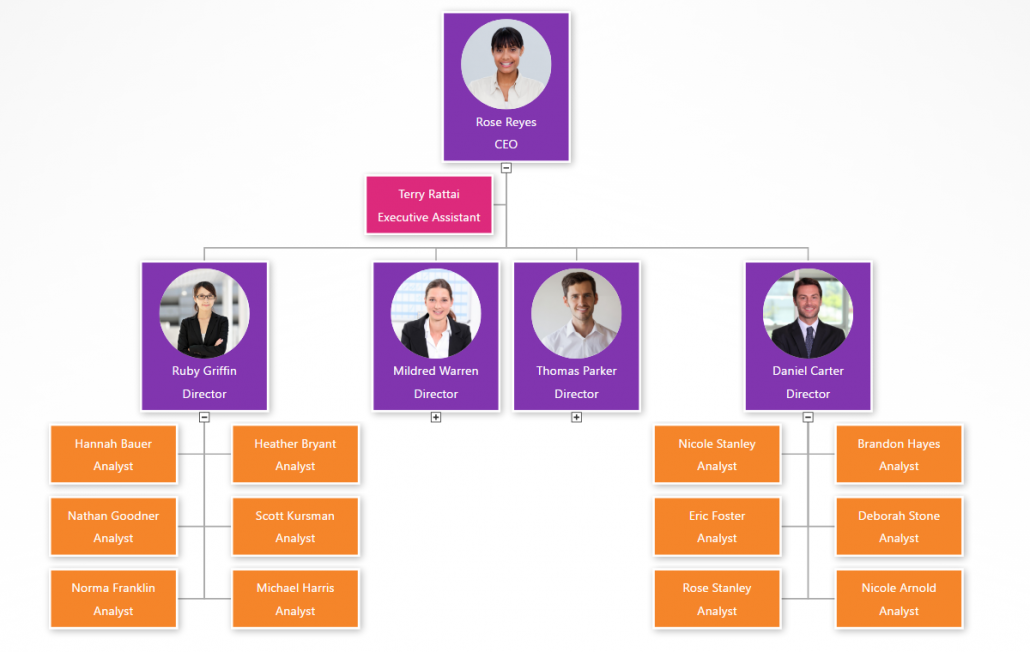
Purple org chart colors like Instagram’s brand

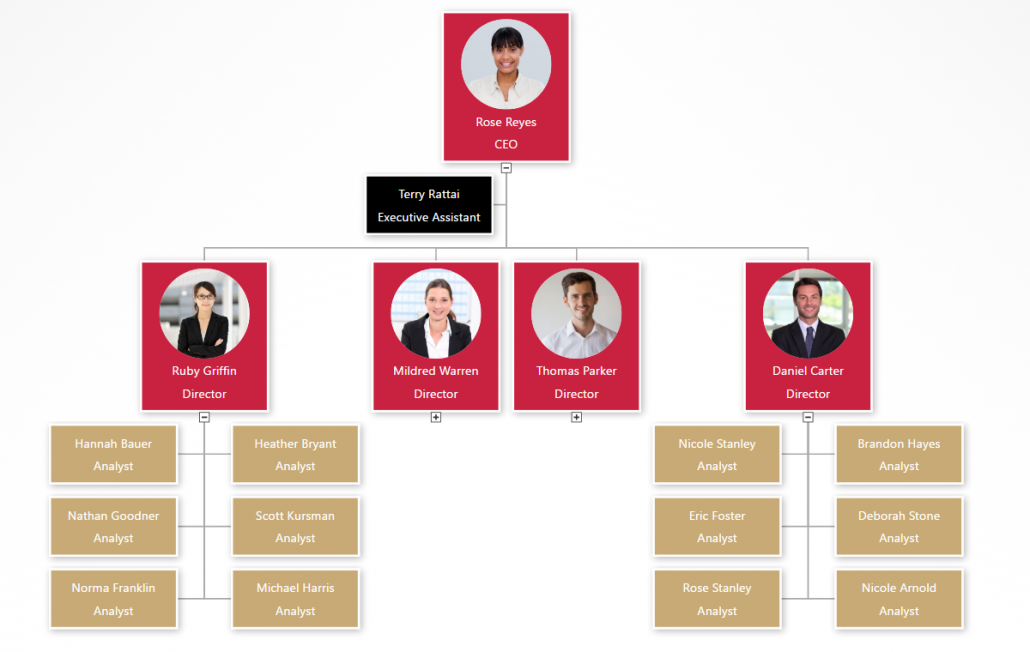
Red and gold org chart colors like the 49er’s brand

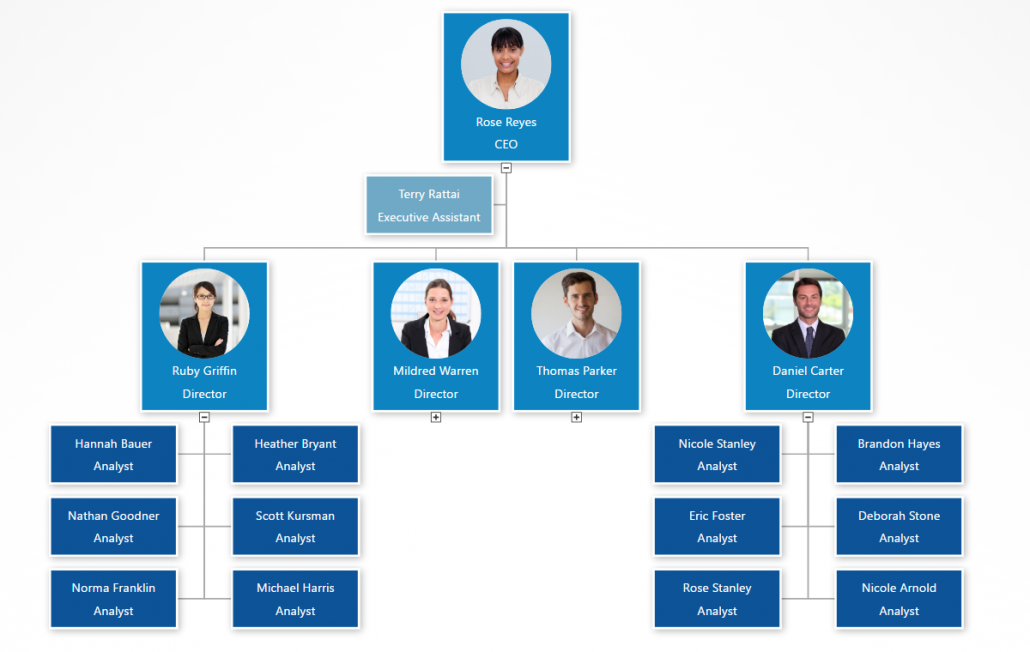
Simple blue org chart colors

Convinced that adding your official colors to your org chart could have more impact? Then go find your brand’s Hex colors right away. If you don’t have a great org chart software yet, then get started creating a colorful org chart with OrgWeaver for free.

Compare Org Chart Alternatives in 2017

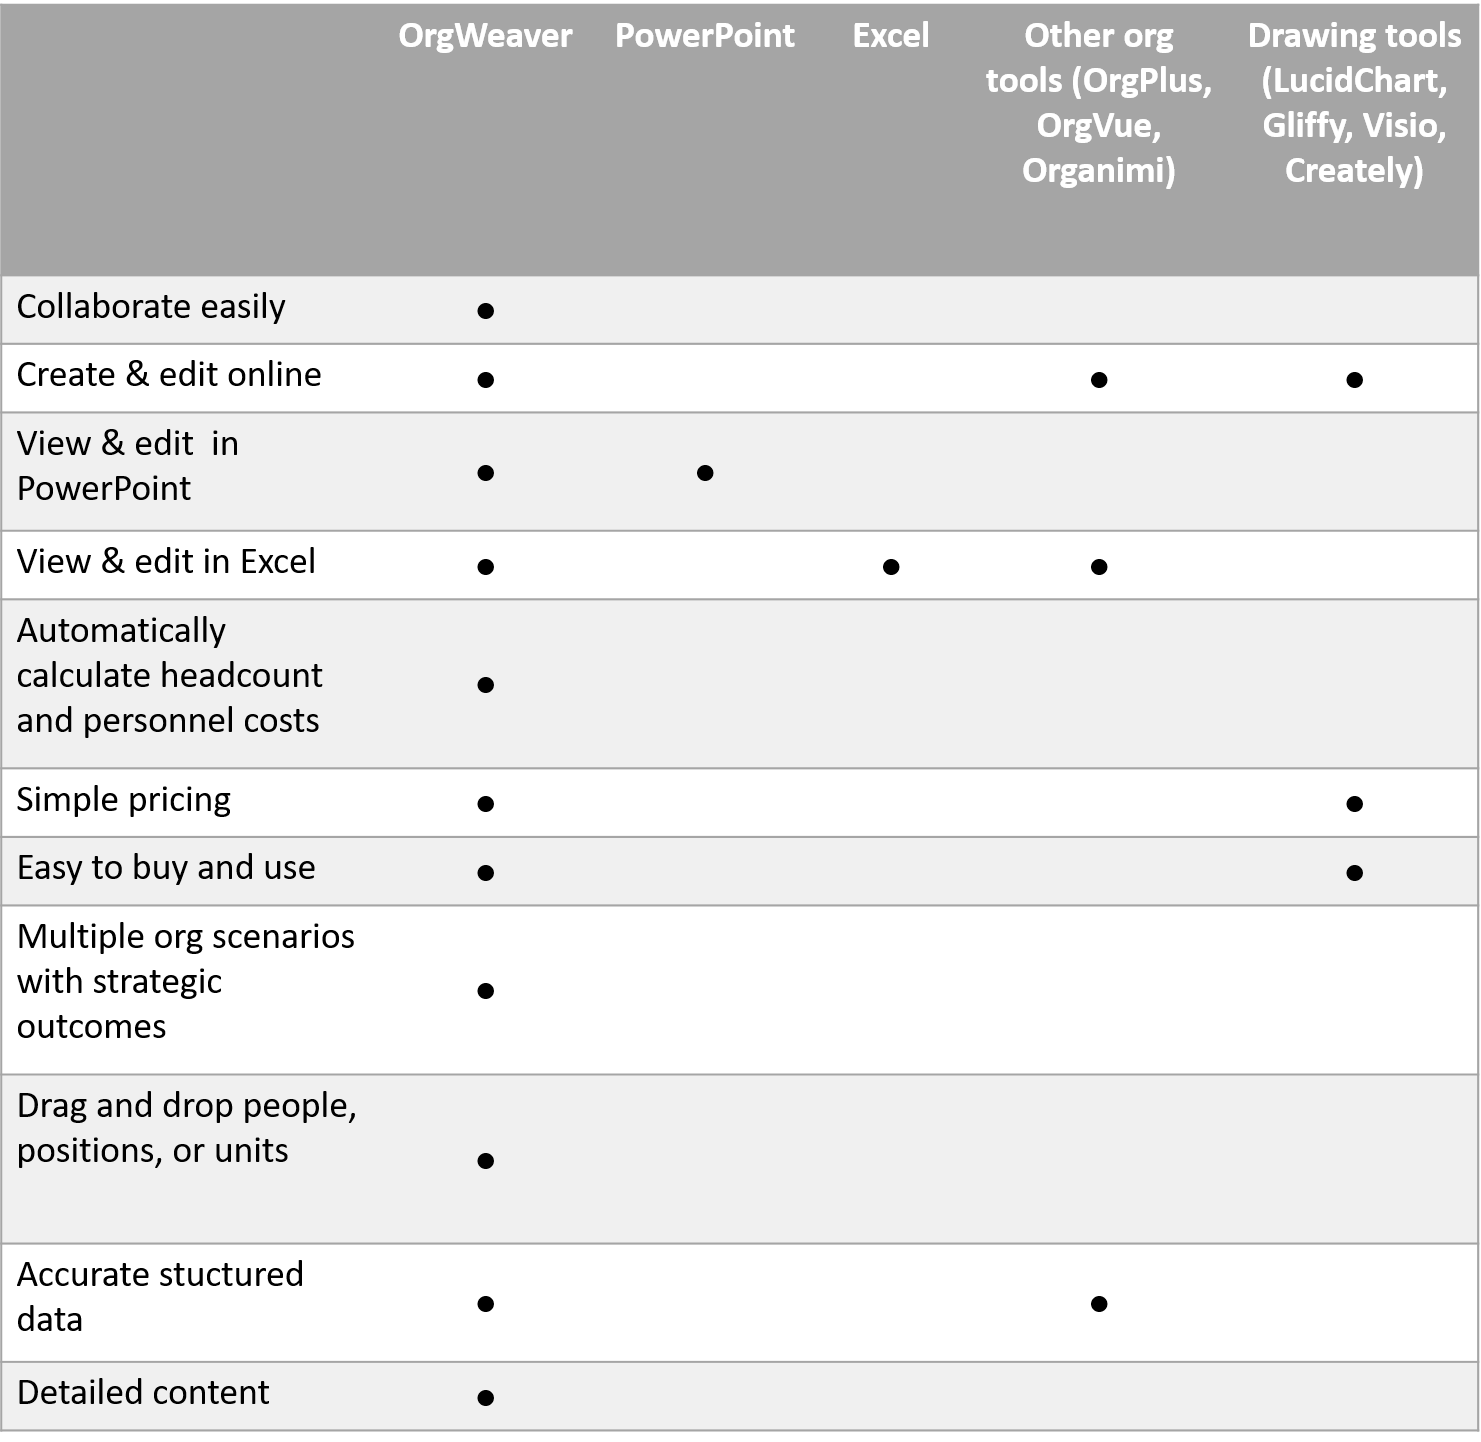
org chart software with custom colorsIt can be confusing to compare org chart software. There are tools to draw org charts by hand. There are tools to build org charts automatically from data. There are even tools that should never be used to make an org chart, but are still popular (watch out for Visio).

Here at OrgWeaver, we make modern online org chart software. We spend a lot of time figuring out what works and what doesn’t for org chart users. Instead of keeping that analysis to ourselves, we thought it’d be helpful to share. Here’s our main points for how to compare org chart software alternatives.

Quick summary

An org chart software should have simple affordable pricing (like LucidChart or Gliffy), automatically create org charts from data (like OrgPlus or Organimi), and still integrate fully with PowerPoint and Excel. We built OrgWeaver to fit into that sweet spot, but the proof can be seen first hand in our free org chart subscription plan.

Collaborate easily

What’s the point of having an org chart if you can’t collaborate in real-time around it? This is often a frustrating part of finding an org chart software. In fact, many people give up and just get 10 people in a room drawing on a whiteboard.

Benefits:

  • Communicate clearly
  • Make decisions faster

Create & edit online

Desktop software is very limiting. That’s why the whole world seems to be moving to online tools that work in any web browser on any device. There is no “Facebook for your Desktop” for a reason. And org chart software should be no different.

Benefits

  • Work anywhere
  • Keep your data safe

View & edit in PowerPoint

PowerPoint is a fact of life. If you’re going to present your org chart, you’re going to want to do with the most ubiquitous presentation software. Even though you want to keep your org chart online, it’s nice to export and make small tweaks in PowerPoint so that you’re presentation is designed perfectly.

Benefits:

  • Flexibility
  • Ease of use

Automatically calculate headcount and personnel costs

An org chart is so much more than boxes. It can show how your organization truly works today. It can be a strategic necessity when designing an organization for the future. Everyone wants to know how many people work in which departments, so it’s important that your org chart software automatically calculates that out of the box.

Benefits:

  • Better understanding of today
  • Plan for the future

Simple pricing

If an org chart vendor doesn’t publish their prices, beware of their business model. It’s possible they are trying to sell “nice-to-have” features for astronomical prices that you never actually use. If you can understand a vendor’s pricing without talking to a sales person, that’s typically a good sign that they are focused on adding value at a competitive price.

Benefits

  • Use what you pay for
  • Budget accurately

Easy to buy and use

If you need an org chart today, you don’t have time to go through a purchasing process. If you can get started for free, upgrade in the org chart software with a credit card, and train yourself with in-app tutorials, you can save a huge amount of time and costs in the purchasing process.

Benefits

  • Try before you buy
  • Train yourself

Multiple org scenarios with strategic outcomes

An organization isn’t just one org structure. It’s last years’ org structure and next years’ org structure. There are different scenarios to consider, and stages to an implementation of a new org structure. Great org chart software solutions allow you to visualize all the scenarios and their strategic impact.

Benefits

  • Clone existing org charts to plan for future structures
  • Get everyone on board with org changes

Drag and drop people, positions, or units

Org charts are easily understood when one box represents one person’s role. So that’s how they usually get created. But behind that simplicity there are more complex decisions. What if you want to move an org unit of 30 people to another org unit? Wouldn’t it be great to just drag and drop them all at once? Or what if you want to just move a person, but leave their current position empty? It’s important to find a software that allows you to just drag and drop exactly what you want.

Benefits

  • Control
  • Quick changes

Accurate structured data

When making a comparison of org chart alternatives, it can be easy to focus only on looks. But behind every org chart box is data that needs to be structured. For instance, if you draw an org chart, none of the data is structured. It can’t be analyzed or updated automatically.

Benefits:

  • Update automatically
  • Better analysis

Detailed content

The bigger the org chart, the less information it shows. That’s why it’s important to find an org chart software that has smart ways to show detailed content even on big org charts. For instance, if you want to show a photo, name, position, headcount, location, email address, phone number, personal bio, and position description on one org chart box, you better be able to design the box well.

Benefits:

  • Explore deep content
  • Search for keywords in descriptions

Org Chart Alternatives Comparison


Compare org chart software alternatives

Simple Org Chart For L1 Visa Application

Tens of thousands of companies apply for L-1 visas every year to make their businesses run smoothly. L-1 visas come in various types, but let’s focus on L-1A visas that allow managers and executives from foreign offices to live and work in the United States for up to 7 years.

Before you start filling out all of the paper work, make sure you can prove that the applicants are managers or executives. According to the U.S. Citizenship and Immigration Services website, here are some clear ways to prove someone is a manager or executive:

  • Show the organization chart of their position (tip: make one for their home office, and one for the new position they will have in the U.S.)
  • Include organizational job descriptions of the applicant, their subordinates, and their superiors

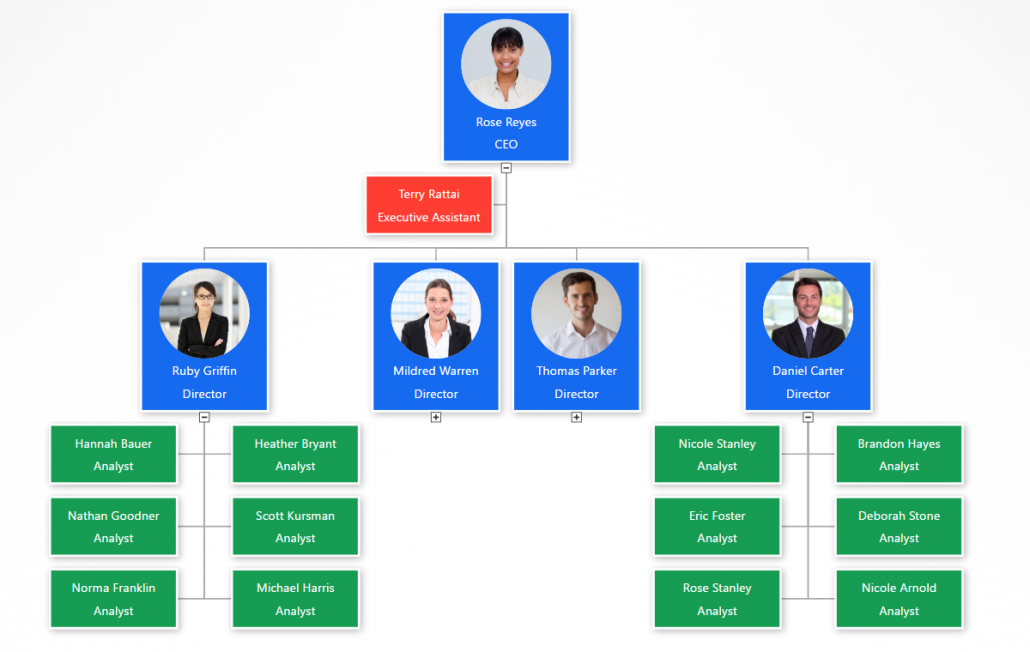
Here’s an example org chart.

To get an L1 visa, the company needs to file Form I-129 (not the individual who will receive the visa). This puts a big burden on HR personnel to get the details right the first time. If the first application doesn’t include everything clearly (like an org chart and job description), then the USCIS can send a dreaded Request for Evidence (RFE) that can postpone the process even further.

Clarity is key when making an org chart for an L-1 visa application. This forum post explains that the USCIS wants simple org charts with just the names of people and their positions. No need to complicate things with division names and dotted-lines. Stick to a basic hierarchy that shows how the applicant works as a manager within a chain of command that ends with the CEO.

The I-129 Form requires a few more pieces of data that you should be able to find in your corporate org chart:

  • Number of employees inside the U.S.
  • Number of employees outside the U.S.
  • Number of employees in the U.S. with managerial or executive positions

If you don’t have an up-to-date org chart for the L-1, then that’s where an online org chart tool can be very helpful. Before choosing an org chart software, check that it can do these things:

  • Automatically draw and place org chart boxes in a hierarchy
  • Add people names, positions, and position descriptions
  • Quickly create an org chart from simple spreadsheet data
  • Drag-and-drop org chart boxes to change reporting lines (hierarchy)
  • Export to PowerPoint in your corporate colors and styles
  • Clone an org chart to show the current state and future state of the organization
  • Calculate the number of positions that report to a manager automatically

Before you go off searching for the right org chart software, know that OrgWeaver does all of these things and you can create a free account quicker than a few Google searches.

L-1 Visas can be a pain, but the reward is definitely worth it for your business. If you know what to expect from the process, have the right org chart tools and a good team, then you can get through the application without so much pain.

L1 Visa org chart