How to create an IT Org Chart for Modern DevOps

Time is running out to make an IT organizational structure that can meet the constant “ideate-build-run” iterations of modern development operations (DevOps).

That’s a mouthful of a sentence, so let me break it down. First up, let’s tackle who is advocating this. Sriram Narayan is an IT Management Consultant at ThoughtWorks who wrote the book on Agile IT Org Design. Recently, Sriram made some slides explaining why it is so important for DevOps to get a new org chart.

Ideate-Build-Run DevOps

Think of DevOps like a city. The person who designs a new road doesn’t build it. And the person who builds the new road doesn’t fill in potholes. That’s what traditional DevOps is like. The problem with this traditional approach is a lack of quality. The designer doesn’t feel the pain of having to maintain what was designed, so designs don’t get better.

Instead, with DevOps, the team who comes up with an idea for an improved software should also build the software and run the software. That’s what Sriram means by “Ideate-Build-Run”.

This goes against more traditional business approaches where specialization is all important. But if specialization doesn’t always lead to better quality products, then it is important to rethink how things get built.

The benefit is that the process is a virtuous loop. The pain of running something gives builders better ideas on how to avoid the pain.

A new normal for DevOps teams

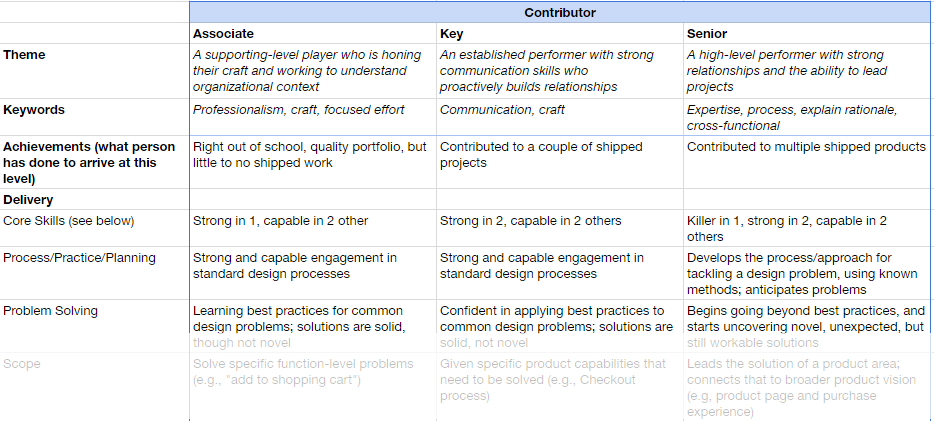
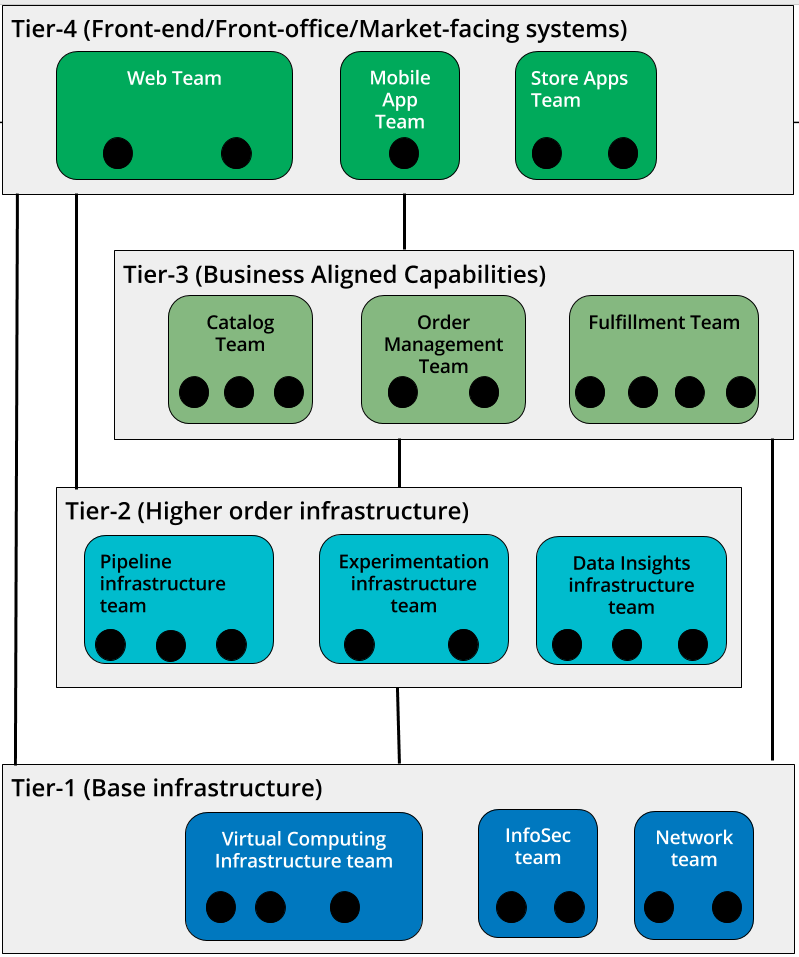
Sriram visualized a four tier concept for structuring DevOps teams. The idea is that each tier of teams has a constant “Ideate-Build-Run” process for their area of DevOps.

devops org design tiers

Time is running out

If you buy in to the idea of Ideate-Build-Run DevOps, then the next questions is “Why now?”.

Every thing is becoming digital. Companies like Amazon would be expected to push the envelope through experimentation. But more traditional companies like Banks usually wait for stacks of best-practice case studies before changing they way they do things. There is not time for this anymore because Banks are digital businesses too, and have to act quickly like the best digital businesses.

In order to implement these core ideas, it’s important to have an org chart software that can easily manage different scenarios and quick changes.
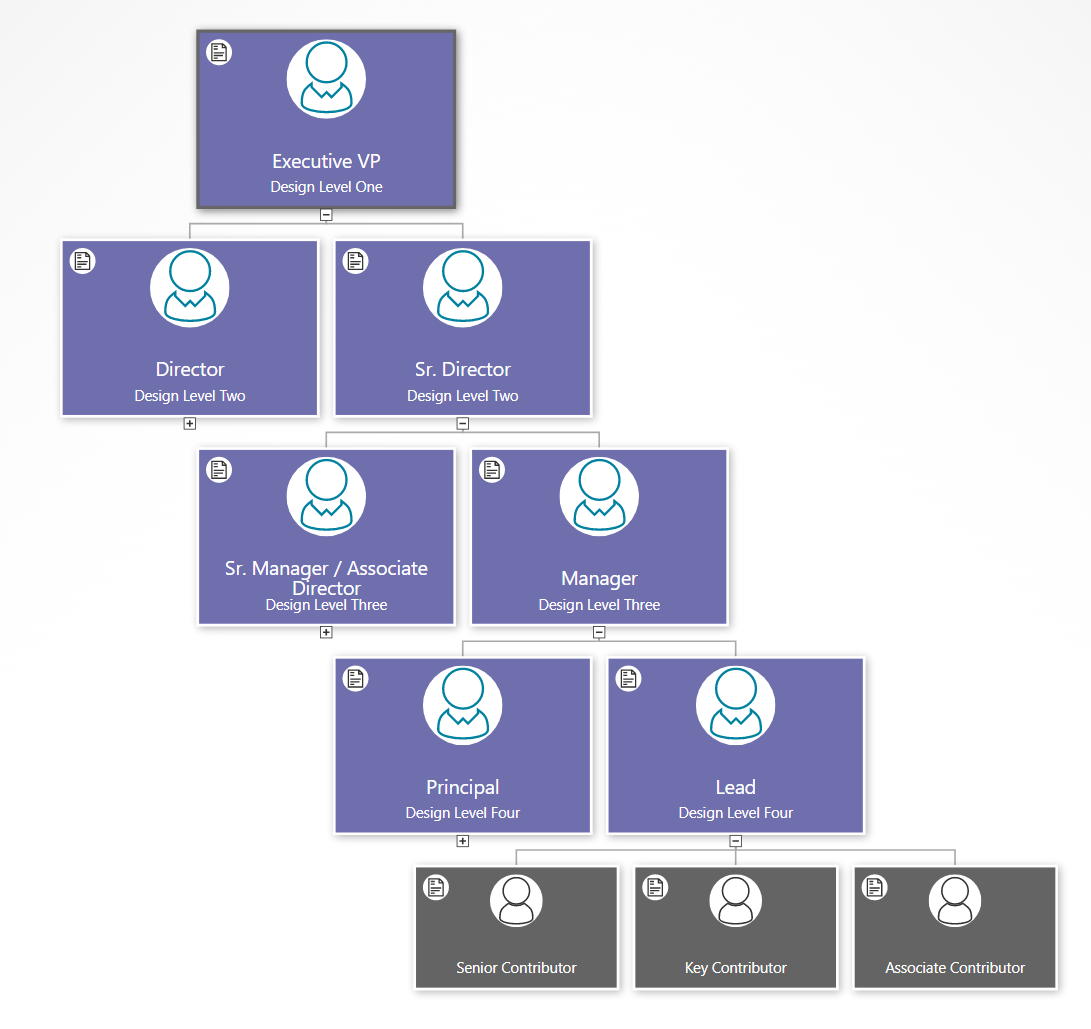
DevOps IT Org Chart

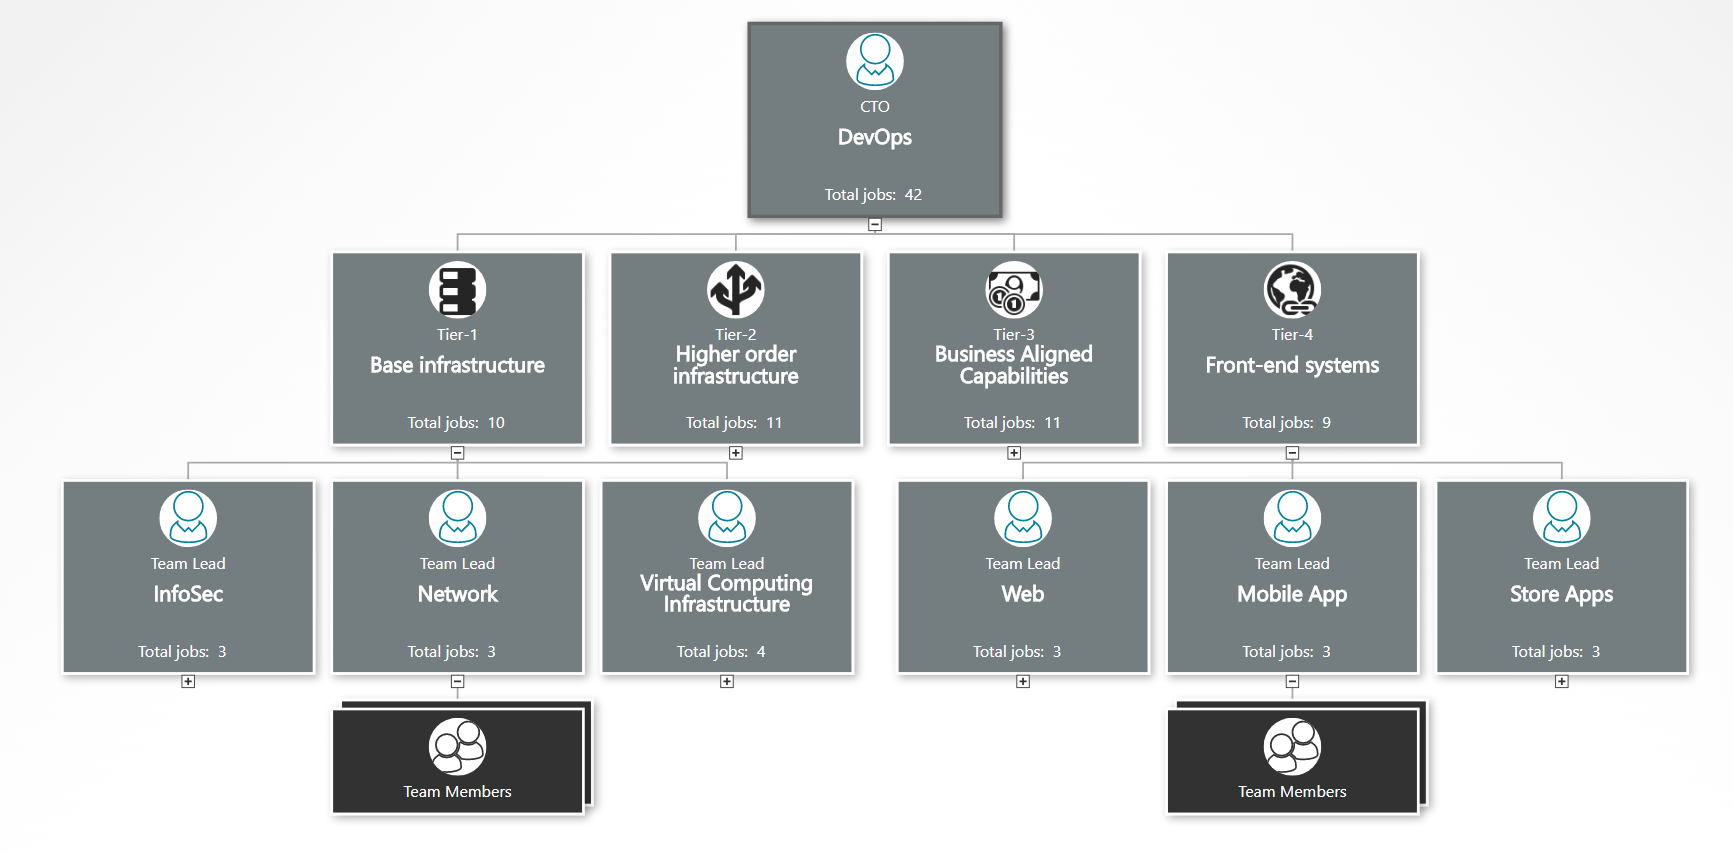
Sriram’s slide inspired me to make an org chart version that clearly shows job titles and reporting structures. Click the org chart below to search and explore the org chart live.

DevOps IT org chart example

Create your own org chart

If you want to apply these organizational structure ideas to your own teams, I’d be glad to send you an example Excel file that you can use to organize your data and then upload to an org chart software like OrgWeaver. Just send an email to nick [at] orgweaver [dotcom] with the subject “Dev Ops org chart template”.

Example: Org Chart Levels for Designers

Peter Merholz literally wrote the book on “Org Design for Design Orgs.” Org design isn’t easy, which is why it’s very helpful to look to experts like Peter before diving into it. In his blog post entitled “Have better career conversations with your design team with this levels framework“, Peter actually shares detailed job descriptions for each level of his design org.

org design level example

The design team role descriptions include:

  • Executive VP
  • Sr. Director
  • Director
  • Sr. Manager / Associate Director
  • Manager
  • Principal
  • Lead
  • Sr. Contributor
  • Key Contributor
  • Associate Contributor

For each role description, Peter outlines these key aspects:

  • Themes
  • Keywords
  • Achievements
  • Delivery
  • Core skills
  • Process/Practice/Planning
  • Problem Solving
  • Scope
  • Communication
  • Presentation
  • Cross-functional Meetings
  • Leadership
  • Relationship with team
  • People Management
  • Recruiting / Hiring

While this is a specific case for one area of a business, the spreadsheet that Peter shares is fascinating for anyone struggling with ways to clearly define roles and organize them into levels.

We often get requests at OrgWeaver to help with visualizing org designs, org levels, and position descriptions. Since Peter was so kind as to share his information with the world, we thought we’d return the favor and visualize his org design online for the world to see. Click the image below to open the interactive online org chart version.

org design levels template

View job descriptions

Within OrgWeaver, it’s easy to view each position description by clicking the document link in the corner of each org chart box. To add position descriptions, we just copied and pasted from Peter’s spreadsheet directly into the org chart.

Organize positions into levels

Based on Peter’s spreadsheet, we added levels for each position in the org chart. Click the expand button at the bottom of the boxes to see lower levels of the org chart. There are of course other ways to define these levels, which is why we built OrgWeaver to easily drag and drop positions into a different hierarchy.

How the Oakland A’s get more from their organizational structure

Billy Beane is the legendary Executive Vice President of Baseball Operations for the Oakland Athletics. It’s not often one gets played by Brad Pitt in a major motion picture because one takes a “data first” approach to management (Moneyball).  We are strong believers in “data first” here at OrgWeaver when it comes to organizational structures, so we were naturally pleased to be able to help out the Oakland A’s.OrgWeaver org chart software used by Oakland A's

When the senior leadership of the Oakland A’s wanted to make some organizational structure changes, they searched the web to find the best org chart software. Here’s what they needed:

  • Beautiful org chart design (with their team colors)
  • Profile pictures
  • Easy navigation
  • Drag and drop editing
  • Collaboration and sharing
  • Structured data

It was quickly obvious that the typical option for org charts (PowerPoint) wouldn’t meet their needs.

Why PowerPoint is bad for org charts

PowerPoint is great for many things, but not for org charts. It is limited because it is essentially a drawing software. Each org chart box needs to be created one by one. And many times if you want to make a simple change to one org chart box, you have to rearrange all of the other org chart boxes. This makes it too time consuming to explore different organizational structure options. For those of you have have tried to design a complex org structure in PowerPoint, you understand why it always ends up as a dead document that goes unused (because no one wants to spend the time to update it).

Why the Oakland A’s chose OrgWeaver

The short answer is that OrgWeaver is specifically built to handle org charts and is the best org chart software available online. For the long answer, here’s a quote directly from the A’s:

“We needed a dynamic org chart that looks great and is easy to drag and drop. Our goal was to have our senior leadership spec out a new org structure and then share it with the entire team. OrgWeaver has been invaluable in that process. Compared to PowerPoint and a few other options we tried, OrgWeaver is easy to use and does a lot of the hard work for you. I’d definitely recommend it to others who need an org chart software.”

-Dash Davidson, Strategic Assistant to the President, Oakland Athletics

Why org charts matter

The Oakland A’s are not alone in their need to make better org charts. Other sports teams, businesses, and governmental agencies also need to align changes with senior leadership before communicating a new org structure in a way that everyone understands. Org charts matter because they are like a map of how teams work together. Without them, the only way to navigate through an organization is if one personally knows every colleague and their daily tasks.

So, steal a strategy from the Oakland A’s playbook and try OrgWeaver if you agree that org charts matter.

3 Essential Ways to Get the Most From Your Organization Chart

Organization charts are essential for many businesses. Next time you’re thinking of upgrading to a modern org chart software, remember these essential things:

1. Search your org chart quickly

Can you imagine trying to read an organization chart that includes hundreds or thousands of employees? It’s an impossible task. That’s why being able to quickly search all of the data in your org chart is such an essential time-saver.

  • Search for anyone who holds the position “Director” (even if you spell it wrong)
  • Search for people named “John”
  • Search for the “Finance” unit

Search_within_an_organization_chart.gif

2. Keep your official style and colors consistent in published org charts

Org charts are a great way to communicate with your team, vendors, shareholders, and others. Just like the effort you put into making beautiful marketing material, effort is required to make sure your org charts consistently communicate your brand.

Org charts typically get published as PowerPoint or PDF files. Make sure you can control these key things when you publish:

  • Size, shape, color, shadow, and outline of every org chart box
  • Header, footer, and background styles
  • Fonts, text size, and employee photo placement

Use_any_PowerPoint_template_640.gif

3. Automatically update your org chart

After you get everything correct in your organization chart, it’s best not to have to start from scratch each time changes need to be made. Modern org charts should be easy enough to update quickly and often.

Org chart software that can do these things can save you a lot of time.

  • Update org chart data based on an Excel spreadsheet
  • Drag-and-drop org chart boxes for quick changes in meetings
  • Export org chart data so it can be used in other systems

OrgWeaver has you covered

A new version of OrgWeaver was released today that covers these 3 essential ways to get the most out of your org chart. Want to test if OrgWeaver can help you save time and money? It’s easy and free to sign up for an OrgWeaver account.